
Proteome-wide 3D structure prediction provides insights into the ancestral metabolism of ancient archaea and bacteria
Ancestral metabolism has remained controversial due to a lack of evidence beyond sequence-based reconstructions. Although prebiotic chemists have provided hints that metabolism might originate from non-enzymatic protometabolic pathways, gaps between ancestral reconstruction and prebiotic processes mean there is much that is still unknown. Here, we apply proteome-wide 3D structure predictions and comparisons to investigate ancestorial metabolism of ancient bacteria and archaea, to provide information beyond sequence as a bridge to the prebiotic processes. We compare representative bacterial and archaeal strains, which reveal surprisingly similar physiological and metabolic characteristics via microbiological and biophysical experiments. Pairwise comparison of protein structures identify the conserved metabolic modules in bacteria and archaea, despite interference from overly variable sequences. The conserved modules (for example, middle of glycolysis, partial TCA, proton/sulfur respiration, building block biosynthesis) constitute the basic functions that possibly existed in the archaeal-bacterial common ancestor, which are remarkably consistent with the experimentally confirmed protometabolic pathways. These structure-based findings provide a new perspective to reconstructing the ancestral metabolism and understanding its origin, which suggests high-throughput protein 3D structure prediction is a promising approach, deserving broader application in future ancestral exploration.
.png)
A Schematic diagram of the AlphaFold2-based proteome-wide structure prediction was used in this study. B Phylogenetic positions of the Zhurongbacteria superfamily and Thermococcales to which 3DAC and A501 belong. “+” represents conserved in ortholog or structure or function; “−” represents not conserved; “±” represents in some cases the active site is conserved but in most cases not. “ABCA” represents the archaeal-bacterial common ancestor. “Arc-Bac divergence/temperature adaptation” means independent evolution after the division of archaea and bacteria or according to temperature adaptation. “LUCA” represents the last universal common ancestor. C Growth features in the temperature range of A501 and 3DAC. Error bars represent the standard deviations (SDs) from independent biological triplicates (n = 3) during the experiments under 0.1 MPa. Data are presented as average values ± SD. D Mean square displacement, 〈X2 (∆t)〉, of biomacromolecules in strains A501 and 3DAC as a function of temperature in vivo compared with a mesophilic model strain Escherichia coli (E. coli). E Mean macromolecular resilience 〈k’〉 for E. coli, 3DAC and A501. The 〈k’〉-values of E. coli, 3DAC and A501 is 0.31 ± 0.020, 0.67 ± 0.015, 0.78 ± 0.022 N/m, respectively. The 〈k’〉 errors were calculated from the slope of the weighted straight-line fits to the mean squared atomic displacement (MSD) data by using the Levenberg–Marquardt algorithm30. Biologically independent samples (n = 3) were mixed to examine over one independent experiment for neutron scattering. Source data are provided as a Source Data file.
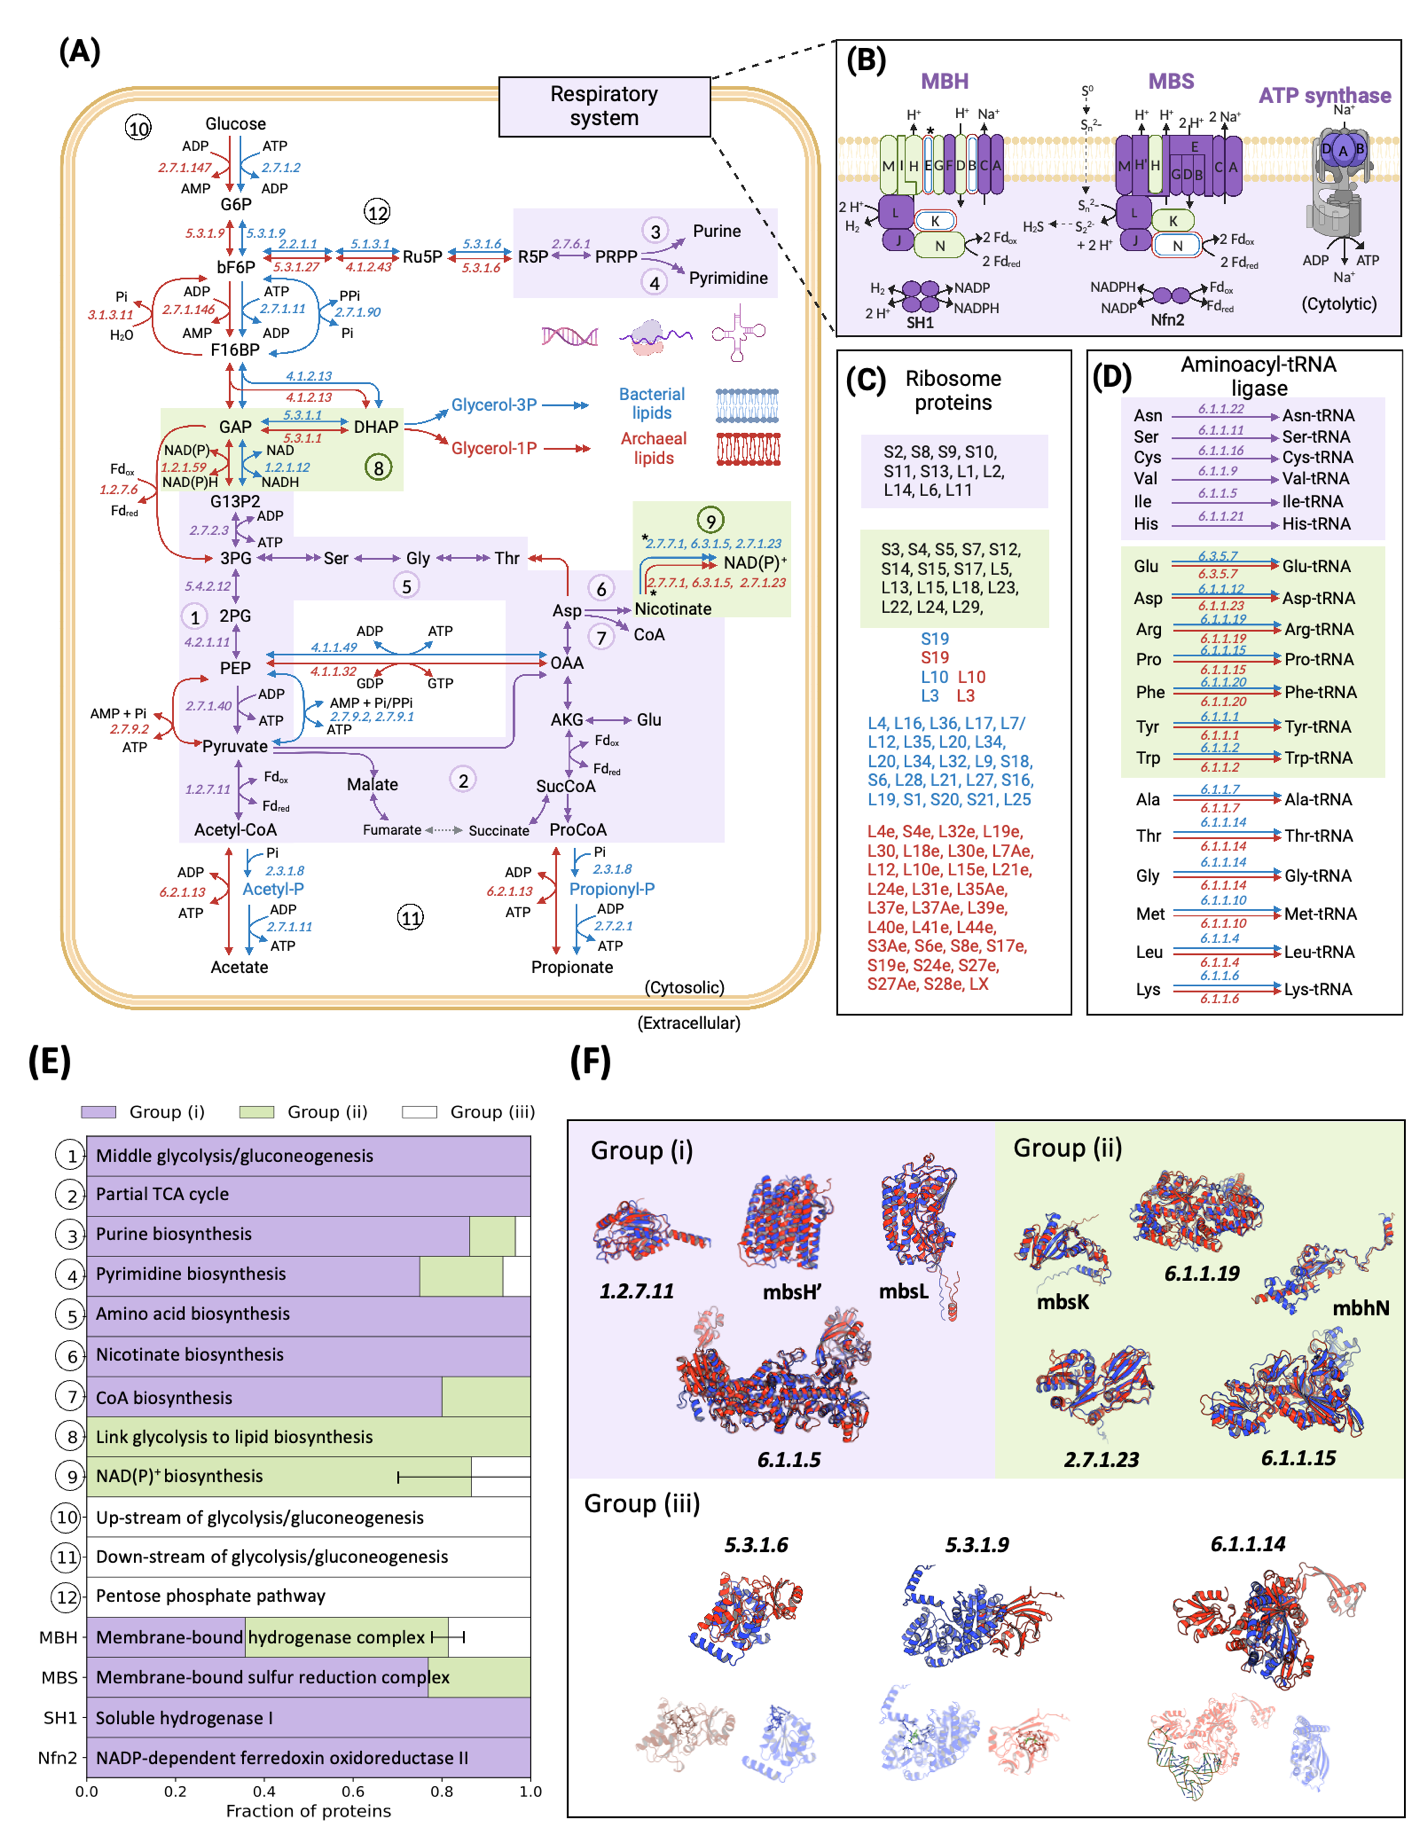
Classification of proteins is based on the similarities of sequence, structure and function between protein pairs of A501 and 3DAC. Proteins with the same or similar functions were classified into three groups: Group (i), (i) ortholog sequence with similar structure and similar function (in purple); Group (ii) nonortholog sequence but similar structure and function (in green); and Group (iii) nonortholog with different structure but similar function (in white). The cutoff of similar sequences is identity ≥30% (bidirectional best hits with coverage >70% and p-value < 1e−5), while the cutoff of similar structures is SiMax score <6 Å. A Central metabolism. B Energetic respiratory system. C Ribosome proteins. D Aminoacyl-tRNA ligase. E Fraction of proteins from three groups in each metabolic module. F Representative cases of protein comparison between A501 (red) and 3DAC (blue) with the same/similar functions in the three groups. Arrows represent biochemical reactions between two compounds. Double arrows indicate that multiple reactions are involved in the conversion between two shown compounds. Numbers in italics beside arrows represent the EC number of enzymes that catalyze the biochemical reactions. Metabolic modules: ① Middle glycolysis/gluconeogenesis (G13P2 to acetyl-CoA); ② Partial TCA cycle; ③ Purine biosynthesis; ④ Pyrimidine biosynthesis; ⑤ Amino acid biosynthesis; ⑥ Nicotinate biosynthesis; ⑦ CoA biosynthesis; ⑧ Link between glycolysis and lipid biosynthesis (DHAP to G13P2); ⑨ NAD(P) + biosynthesis; ⑩ Upstream of glycolysis/gluconeogenesis (glucose to GAP); ⑪ Downstream of glycolysis/gluconeogenesis (acetate/propionate production); ⑫ Pentose phosphate pathway; MBH membrane-bound hydrogenase complex, MBS membrane-bound sulfane sulfur reduction complex; SH1 soluble hydrogenase I; Nfn2 NADP-dependent ferredoxin oxidoreductase II. Abbreviations of metabolites: 2PG D-glycerate 2-phosphate, 3PG 3-phospho-D-glycerate, Acetyl-P acetyl phosphate, AKG 2-oxoglutarate, bF6P beta-D-fructose 6-phosphate, DHAP dihydroxyacetone phosphate, F16BP beta-D-fructose 1,6-bisphosphate, Fdred reduced ferredoxin, Fdox oxidized ferredoxin, G13P2 D-glycerate 1,3-diphosphate, G13P2 D-glucose 6-phosphate, GAP glyceraldehyde 3-phosphate, Glycerol-3P glycerol 3-phosphate, OAA oxaloacetate, PEP phosphoenolpyruvate, Pi phosphate, PPi diphosphate, ProCoA propionyl-CoA, Propionyl-P propionyl phosphate, R5P D-ribose 5-phosphate, Ru5P D-ribulose 5-phosphate, SucCoA succinate CoA. “*” Represents the two protein pairs, i.e., EC 2.7.7.1 and mbhE, which have the variable normalized RMSD values that shift the group classification using a different model of AlphaFold2. Error bars in E represent the variation of group classification in Nicotinate biosynthesis and MBH caused by the variable normalized RMSD values of the above two protein pairs. Source data are provided as a Source Data file.
Reference:
Weishu Zhao#, Bozitao Zhong#, Pan Tan, Lirong Zheng, Yinzhao Wang, Hao Leng, Nicolas de Souza, Liang Hong*, Xiang Xiao* (2022). Proteome-wide 3D structure prediction provides insights into the ancestral metabolism of ancient archaea and bacteria. Nature Communications
Link: www.nature.com/articles/s41467-022-35523-8